DevOps Monitoring Dashboard UI Template

About
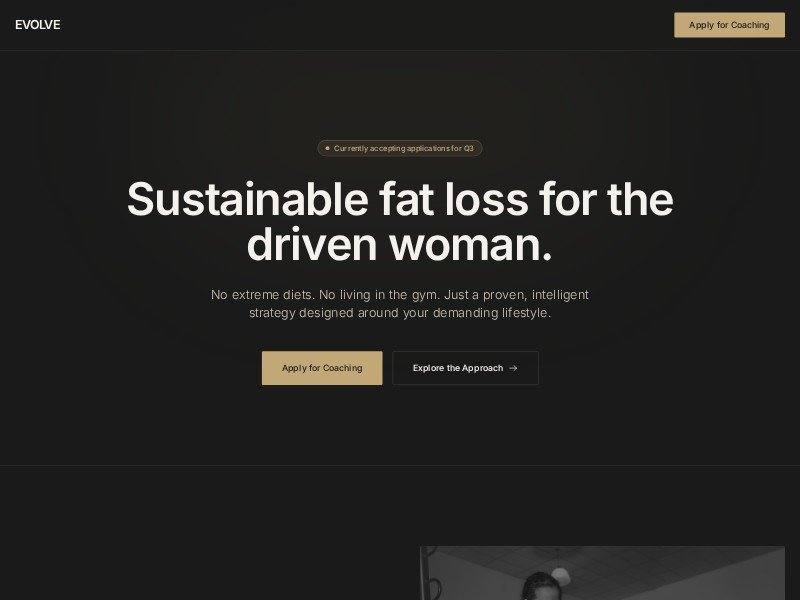
A dark, futuristic DevOps monitoring dashboard UI template for system status, traffic analytics, and deployments—ready to customize for your own platform.
NexusOS DevOps Dashboard UI Template delivers a sleek, dark monitoring interface for modern infrastructure teams.
What's Included
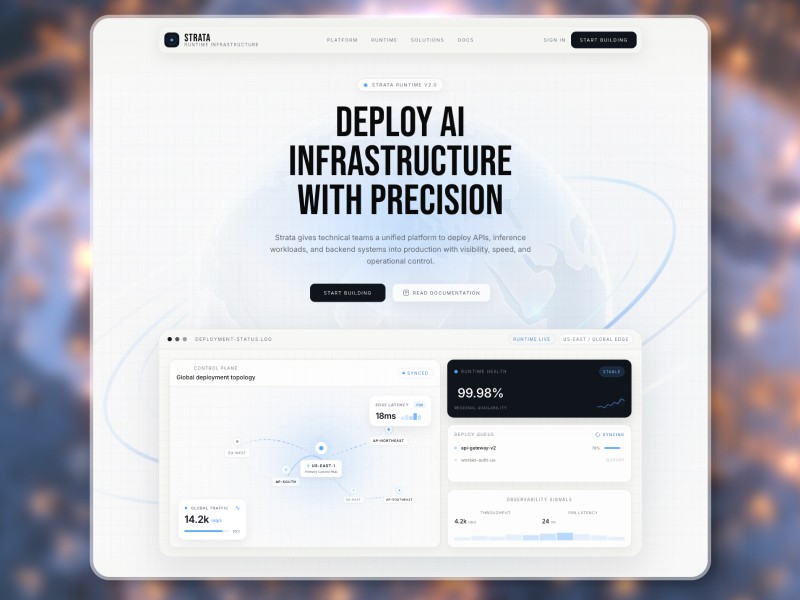
- System status KPIs for CPU, latency, storage, and requests
- Interactive traffic overview chart with gradients and tooltips
- Quick settings panel for maintenance mode, auto-scaling, and throttling
- Service health list with live-style status indicators
- Recent deployments table with environments, commits, and statuses
Primary Use Case
Perfect as a starting point for DevOps, SRE, or SaaS admin consoles that need a polished system overview experience.
Benefits
- Brand-forward dark, futuristic aesthetic ideal for technology products
- Tailwind CSS–based layout that’s easy to adapt and extend
- Production-like structure with sidebar nav, header, charts, and tables for rapid prototyping.
Created
January 2, 2026
Category
Web
Remixes
1
FAQs
Creator
Joined 4 months ago
5 designs
39 profile views