Interactive Network Topology Visualization
1 views
0 remixes
About
A full-width animated dashboard section featuring live network topology stats and a Three.js WebGL globe visualization. Uses Tailwind-style utility classes, hover effects, count-up metrics, and responsive motion for data, infrastructure, or SaaS interfaces.
Created
Mar 23
Updated
Mar 23
Remixes
0
Creator

Sourany Phomhome
View profileTags
More from Sourany Phomhome

Interactive 3D Team Carousel
1003

Scroll-Animated 3-Card Hero Gallery
1637
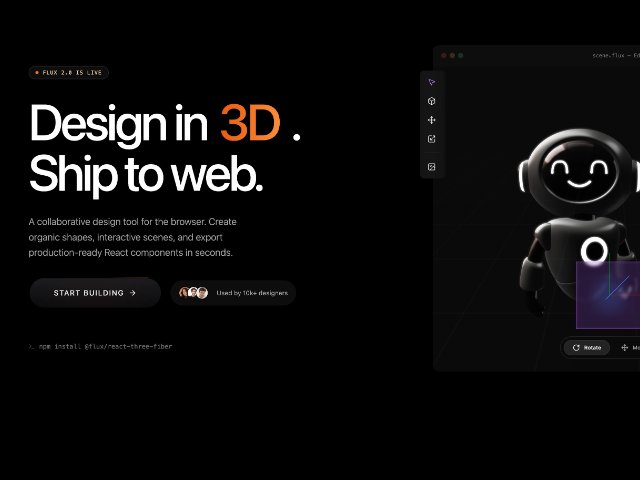
3D Design Tool Hero with Interactive Preview
1665

Glowing CTA Button with Arrow Icon
802

Interactive Glassmorphism Testimonial Stack
PRO1946
Related Components

Animated Border Call-to-Action Button
PRO1204
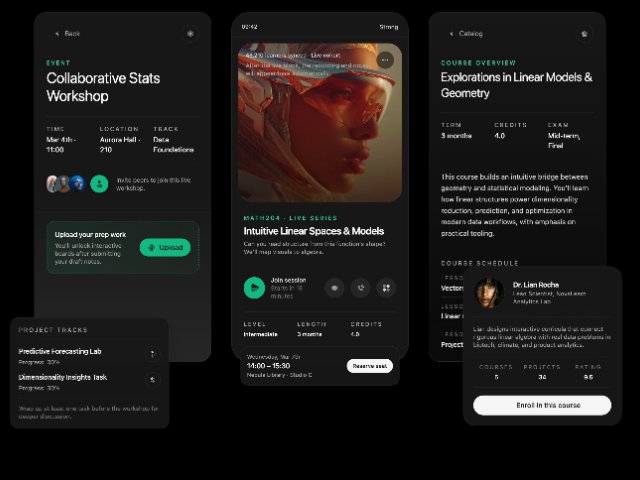
Educational Event Dashboard Layout
PRO986
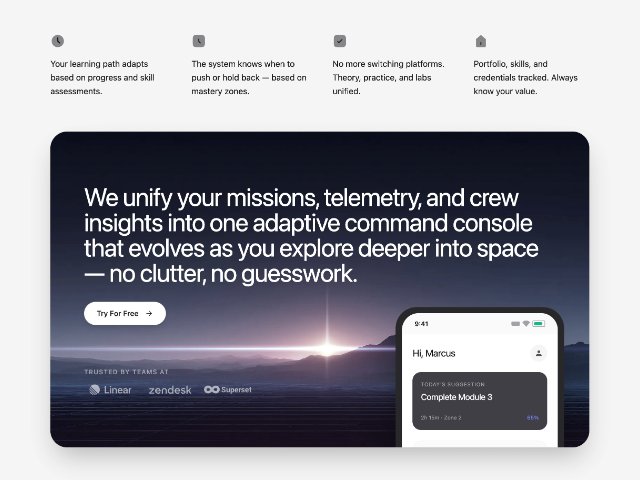
Feature Grid with CTA Card and App Preview
PRO1703
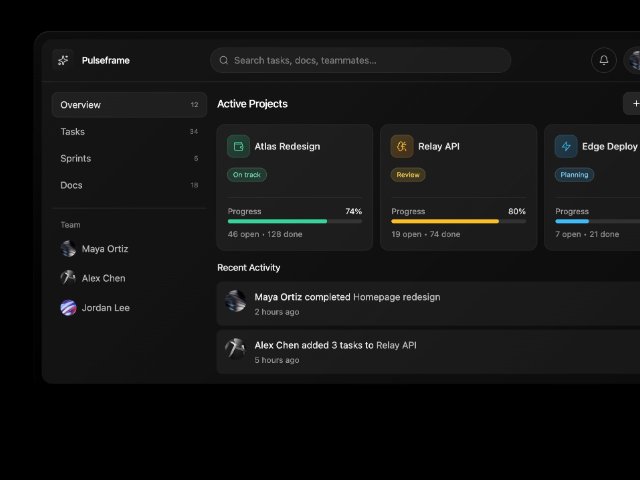
Project Dashboard Card with Sidebar and Activity Feed
386
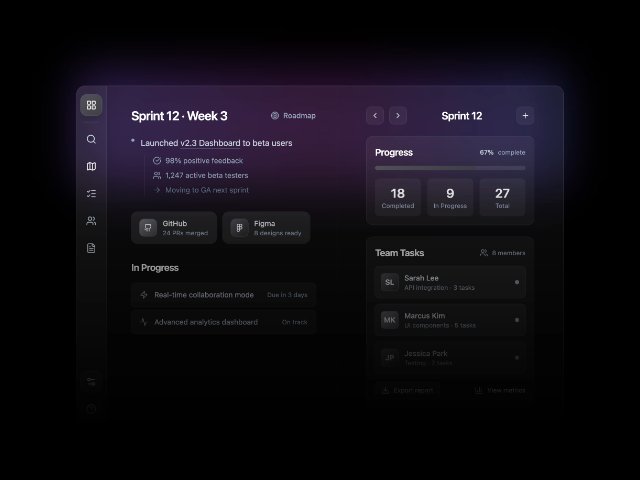
Agile Sprint Management Dashboard with Sidebar
932